coco_pipe.decoding.ExperimentResult#
- class coco_pipe.decoding.ExperimentResult(raw_results, config=None, meta=None, time_axis=None, schema_version='decoding_result_v1')#
Bases:
objectUnified Container for Experiment Results.
Provides tidy data views for easier analysis, visualization, and statistical assessment of decoding performance across multiple models, folds, and temporal coordinates.
Examples
>>> result = Experiment(config).run(X, y)
>>> summary_df = result.summary()
>>> preds_df = result.get_predictions()
- Parameters:
- property time_axis: list[Any] | None#
The scientific time points for temporal decoding results.
- Return type:
list[Any] | None
- to_payload(serializable=False)#
Return the result payload for persistence or transmission.
Converts the internal state into a dictionary containing the schema version, configuration, metadata, and raw model results.
- Parameters:
serializable (bool, default=False) – If True, recursively converts all NumPy arrays, integers, floats, and booleans into standard Python primitives (lists, ints, etc.) suitable for JSON serialization.
- Returns:
payload – The consolidated result payload.
- Return type:
See also
ExperimentResult.savePersist results to disk.
- save(path=None, indent=2)#
Save results to a file, auto-detecting the format from the extension.
Supports both binary formats (via joblib) for speed and disk space, and JSON format for interoperability and human-readability.
- Parameters:
path (str or Path, optional) – The destination path. - If None, uses ‘output_dir’ from the experiment config. - If a directory, generates a timestamped filename with a ‘.pkl’ extension. - If a file path ending in ‘.json’, performs JSON serialization. - Otherwise, uses joblib binary serialization.
indent (int, default=2) – JSON indentation level (only applicable for .json files).
- Returns:
path – The path where the results were saved.
- Return type:
Path
See also
ExperimentResult.loadLoad results from disk.
Experiment.save_resultsExperiment-level wrapper.
- export(output_dir, config=None, formats=('csv',))#
Export the result object and all available tidy tables.
Individual optional table failures are recorded in the run manifest rather than invalidating an otherwise complete experiment.
- Parameters:
output_dir (str or Path) – Destination directory for the result object and tidy tables.
config (dict, optional) – Effective run config recorded alongside the export.
formats (sequence of str, default=("csv",)) – Table formats to write, any subset of
{"csv", "parquet"}. Defaults to CSV only; CSV is required for resuming a run, so keep it in the set unless you only need parquet. Add"parquet"for a columnar copy at the cost of doubling the number of table files.
- Return type:
- classmethod load(path)#
Load results from a file (auto-detects JSON or Pickle).
Reconstructs an ExperimentResult instance from a previously saved payload on disk.
- Parameters:
path (str or Path) – The path to the result file.
- Returns:
result – The rehydrated result container.
- Return type:
- Raises:
FileNotFoundError – If the specified path does not exist.
ValueError – If the file format is unrecognized or corrupted.
See also
ExperimentResult.savePersist results to disk.
- summary()#
Get a high-level summary of performance (Mean/Std and Stats).
Aggregates results across all models and folds into a single benchmarking table.
Scientific Rationale#
A summary table provides a concise overview of model performance expectations and their reliability. By including standard deviations and p-values alongside means, it allows for immediate identification of significant decoding effects and model stability.
- returns:
summary_df – DataFrame with models as index and scalar metrics as columns. Includes p-values and significance markers (‘*’) if statistical assessments were executed.
- rtype:
pd.DataFrame
Examples
>>> # df = result.summary()
>>> # print(df[['accuracy_mean', 'accuracy_p_val']])
See also
ExperimentResult.get_detailed_scoresGet fold-level results.
ExperimentResult.get_temporal_score_summaryTemporal-resolved summary.
- Return type:
DataFrame
- get_detailed_scores(model=None)#
Get fold-level scores for all models or a specific model in long format.
Expands results into a ‘tidy’ format where each row represents a single score for one fold, model, and metric.
- Parameters:
model (str, optional) – The name of the model to filter by. Default is None (all models).
- Returns:
scores_df – Tidy DataFrame with columns: Model, Fold, Metric, and Value. Includes temporal coordinates if the data is time-resolved.
- Return type:
pd.DataFrame
See also
ExperimentResult.summaryMean/Std aggregate view.
- get_temporal_score_summary(model=None)#
Get temporal metric means/stds and significance across folds.
Averages performance metrics across cross-validation folds for each temporal coordinate (Time or TrainTime/TestTime pair).
Scientific Rationale#
Temporal decoding and time-generalization analysis yield multi-dimensional performance arrays. Aggregating these across folds provides an estimate of the central tendency and variance of the model’s ability to decode at specific latency points. Integrating p-values into this view allows for the identification of ‘significant’ time windows.
- param model:
The name of the model to filter by. Default is None (all models).
- type model:
str, optional
- returns:
summary_df – DataFrame in long format with Model, Metric, Time coordinates, Mean, Std, and PValue/Significant columns if statistical assessments were executed.
- rtype:
pd.DataFrame
See also
ExperimentResult.summaryScalar-only summary view.
ExperimentResult.get_generalization_matrix2D matrix view of TG results.
- Parameters:
model (str | None)
- Return type:
DataFrame
- get_predictions(model=None)#
Get concatenated predictions for all models or a specific model.
Converts nested prediction dictionaries from all folds into a single flattened DataFrame.
- Parameters:
model (str, optional) – The name of the model to filter by. Default is None (all models).
- Returns:
predictions_df – Tidy DataFrame of predictions. Includes SampleID, y_true, y_pred, y_score, and probability columns if available.
- Return type:
pd.DataFrame
See also
ExperimentResult.get_splitsMembership of samples in each fold.
- get_splits(model=None)#
Get outer-CV train/test membership in long format for all models.
Tracks which samples were used for training and testing in each fold of the cross-validation procedure.
- Parameters:
model (str, optional) – The name of the model to filter by. Default is None (all models).
- Returns:
splits_df – DataFrame with Model, Fold, Set (train/test), SampleIndex, SampleID, and associated metadata columns (e.g., Subject, Session).
- Return type:
pd.DataFrame
See also
ExperimentResult.get_predictionsLink predictions to splits via SampleID.
- get_fit_diagnostics(model=None)#
Get fold-level timing and warning diagnostics for all models.
Aggregates operational metrics such as execution time and runtime warnings encountered during the model fit and predict stages.
Scientific Rationale#
Runtime diagnostics are critical for identifying computational bottlenecks and ensuring model validity. Long training times may suggest the need for dimensionality reduction, while consistent warnings (e.g., convergence failures) can signal that model hyperparameters are poorly suited to the dataset.
- param model:
The name of the model to filter by. Default is None (all models).
- type model:
str, optional
- returns:
diagnostics_df – DataFrame with Model, Fold, and timing columns (FitTime, PredictTime, ScoreTime, TotalTime). If warnings were captured, includes Stage, WarningCategory, and WarningMessage columns.
- rtype:
pd.DataFrame
Examples
>>> diagnostics = result.get_fit_diagnostics()
>>> # Identify the slowest model
>>> slow_model = diagnostics.groupby("Model")["TotalTime"].mean().idxmax()
See also
ExperimentResult.summaryGeneral performance summary.
- Parameters:
model (str | None)
- Return type:
DataFrame
- get_confusion_matrices(model=None, labels=None, normalize=None)#
Get fold-level confusion matrices in long format.
Computes the confusion between true and predicted labels for each cross-validation fold.
Scientific Rationale#
Confusion matrices provide a granular view of model errors, identifying specific classes that are frequently misidentified. Analyzing these per-fold allows for assessing the consistency of error patterns across different data splits.
- param model:
The name of the model to filter by. Default is None (all models).
- type model:
str, optional
- param labels:
The list of labels to use for the matrix axes. If None, uses all labels present in the predictions.
- type labels:
sequence of any, optional
- param normalize:
Normalization strategy: - ‘true’: Normalize by true labels (rows). - ‘pred’: Normalize by predicted labels (columns). - ‘all’: Normalize by total number of samples.
- type normalize:
{‘true’, ‘pred’, ‘all’}, optional
- returns:
confusion_df – Tidy DataFrame with Model, Fold, TrueLabel, PredictedLabel, and Value.
- rtype:
pd.DataFrame
See also
ExperimentResult.get_pooled_confusion_matrixAggregate across folds.
- get_confusion_counts(model=None, labels=None)#
Get unnormalized per-fold confusion counts.
Equivalent to get_confusion_matrices(normalize=None).
- Parameters:
model (str, optional) – The name of the model to filter by.
labels (sequence of any, optional) – The list of labels to use.
- Returns:
counts_df – Unnormalized confusion counts.
- Return type:
pd.DataFrame
- get_pooled_confusion_matrix(model=None, labels=None, normalize=None)#
Get pooled out-of-fold confusion matrices in long format.
Aggregates predictions from all cross-validation folds before calculating the confusion matrix.
- Parameters:
model (str, optional) – The name of the model to filter by.
labels (sequence of any, optional) – The list of labels to use.
normalize ({'true', 'pred', 'all'}, optional) – Normalization strategy.
- Returns:
confusion_df – Pooled confusion matrix with Model, TrueLabel, PredictedLabel, and Value.
- Return type:
pd.DataFrame
See also
ExperimentResult.get_confusion_matricesFold-level view.
- get_roc_curve(model=None, pos_label=None)#
Get binary or one-vs-rest ROC curve coordinates.
Calculates False Positive Rate (FPR) and True Positive Rate (TPR) at various thresholds for each fold. For multiclass problems, computes One-vs-Rest (OvR) curves for each class.
Scientific Rationale#
Receiver Operating Characteristic (ROC) curves illustrate the diagnostic ability of a classifier as its discrimination threshold is varied. Analyzing the spread of these curves across folds helps in assessing the robustness of the model’s probabilistic rankings.
- param model:
The model name to filter by.
- type model:
str, optional
- param pos_label:
The label to treat as the positive class in binary cases. If None, uses the second class in alphabetical order.
- type pos_label:
any, optional
- returns:
roc_df – DataFrame with Model, Fold, Class, Threshold, FPR, and TPR.
- rtype:
pd.DataFrame
See also
ExperimentResult.get_roc_auc_summaryAggregate AUC metrics.
- get_pr_curve(model=None, pos_label=None)#
Get binary or one-vs-rest precision-recall curve coordinates.
Calculates Precision and Recall at various thresholds for each fold. For multiclass problems, computes One-vs-Rest (OvR) curves for each class.
Scientific Rationale#
Precision-Recall (PR) curves are often more informative than ROC curves for imbalanced datasets, as they focus on the model’s performance on the minority (positive) class.
- param model:
The model name to filter by.
- type model:
str, optional
- param pos_label:
The label to treat as positive.
- type pos_label:
any, optional
- returns:
pr_df – DataFrame with Model, Fold, Class, Threshold, Precision, and Recall.
- rtype:
pd.DataFrame
See also
ExperimentResult.get_pr_auc_summaryAverage Precision summary.
- get_roc_auc_summary(model=None)#
Get summary ROC-AUC metrics across models and folds.
Calculates the Area Under the ROC Curve for each fold, using macro- and weighted-averaging for multiclass tasks.
- Parameters:
model (str, optional) – Model name to filter by.
- Returns:
auc_df – Summary with Model, Fold, MacroROCAUC, and WeightedROCAUC.
- Return type:
pd.DataFrame
See also
ExperimentResult.get_roc_curveDetailed curve coordinates.
- get_pr_auc_summary(model=None)#
Get summary PR-AUC (Average Precision) metrics across models and folds.
Calculates the Area Under the Precision-Recall Curve for each fold.
- Parameters:
model (str, optional) – Model name to filter by.
- Returns:
auc_df – Summary with Model, Fold, MacroPRAUC, and WeightedPRAUC.
- Return type:
pd.DataFrame
See also
ExperimentResult.get_pr_curveDetailed curve coordinates.
- get_calibration_curve(model=None, n_bins=5, pos_label=None, strategy='uniform')#
Get binary reliability/calibration curve coordinates.
Calculates the fraction of positive samples vs. mean predicted probabilities for each probability bin.
Scientific Rationale#
A well-calibrated classifier provides probabilistic outputs that reflect the true likelihood of the predicted event. Calibration curves (reliability diagrams) are essential for assessing whether predicted probabilities can be interpreted as confidence levels.
- param model:
The model name to filter by.
- type model:
str, optional
- param n_bins:
Number of bins to use for the calibration curve.
- type n_bins:
int, default=5
- param pos_label:
The label to treat as positive.
- type pos_label:
any, optional
- param strategy:
Strategy used to define the widths of the bins. - ‘uniform’: Bins have identical widths. - ‘quantile’: Bins have the same number of samples.
- type strategy:
{‘uniform’, ‘quantile’}, default=’uniform’
- returns:
calibration_df – DataFrame with Model, Fold, Class, MeanPredictedProbability, and FractionPositive.
- rtype:
pd.DataFrame
See also
ExperimentResult.get_probability_diagnosticsBrier score and Log Loss.
- get_probability_diagnostics(model=None)#
Get fold-level log-loss and Brier summaries when probabilities exist.
Computes summary metrics that penalize poor probability calibration and high-uncertainty predictions.
- Parameters:
model (str, optional) – The model name to filter by.
- Returns:
diagnostics_df – DataFrame in long format with Model, Fold, Metric, Class, and Value. Metrics include ‘log_loss’, ‘brier_score_ovr’, and ‘brier_score_macro’.
- Return type:
pd.DataFrame
See also
ExperimentResult.get_calibration_curveVisual calibration view.
- get_statistical_assessment(lightweight=False, metric='accuracy', unit=None, n_permutations=1000, random_state=None)#
Get finite-sample statistical assessment rows in long form.
Returns p-values and significance markers for model performance, supporting both full-pipeline and post-hoc permutation methods.
Scientific Rationale#
Statistical significance in decoding ensures that observed performance deltas are not due to chance fluctuations. This method allows accessing pre-calculated results from the full experimental pipeline (the gold standard) or running a faster post-hoc permutation test directly on stored predictions.
- param lightweight:
If True, perform a post-hoc label permutation on out-of-fold predictions. Fast but does not account for pipeline leakage (e.g., in tuning). If False, returns results from the full-pipeline assessment if they were computed during the experiment.
- type lightweight:
bool, default=False
- param metric:
Metric to use for the assessment.
- type metric:
str, default=’accuracy’
- param unit:
The level of independence for the permutation test (e.g., ‘subject’).
- type unit:
str, optional
- param n_permutations:
Number of permutations for the lightweight assessment.
- type n_permutations:
int, default=1000
- param random_state:
Seed for reproducible permutations.
- type random_state:
int, optional
- returns:
stats_df – Tidy DataFrame with Model, Metric, Observed, PValue, and Significance.
- rtype:
pd.DataFrame
See also
coco_pipe.decoding.stats.run_statistical_assessmentUnderlying engine.
- get_statistical_nulls(model=None)#
Return stored statistical null distributions, when configured.
Accesses the empirical null distributions (e.g., from permutation tests) stored during the experiment.
- Parameters:
model (str, optional) – Model name to filter by. Default is None (all models).
- Returns:
nulls – Dictionary mapping model names to their null distribution payloads, containing coordinates and permuted score arrays.
- Return type:
See also
ExperimentResult.get_statistical_assessmentP-values derived from these nulls.
- get_model_artifacts(model=None)#
Return fold-level model artifact metadata in long form.
Accesses non-metric outputs stored by models, such as learned coefficients, intercept values, or class labels.
- Parameters:
model (str, optional) – The model name to filter by. Default is None (all models).
- Returns:
artifacts_df – DataFrame with Model, Fold, ArtifactType, Key, and Value.
- Return type:
pd.DataFrame
See also
ExperimentResult.get_feature_importancesSpecifically for importances.
- get_bootstrap_confidence_intervals(metric='accuracy', model=None, unit=None, n_bootstraps=1000, ci=0.95, random_state=None)#
Bootstrap metric confidence intervals over configured inference units.
Estimates the uncertainty of a performance metric by resampling independent units (e.g., subjects) with replacement.
Scientific Rationale#
Bootstrapping provides a non-parametric estimate of the sampling distribution of a metric. By resampling at the ‘unit’ level, we account for within-unit correlations (e.g., multiple trials from the same subject) and provide more realistic uncertainty bounds than sample-level analytical methods.
- param metric:
The metric to estimate uncertainty for.
- type metric:
str, default=’accuracy’
- param model:
The model name to filter by.
- type model:
str, optional
- param unit:
The level of independence for resampling (e.g., ‘subject’).
- type unit:
str, optional
- param n_bootstraps:
Number of bootstrap iterations.
- type n_bootstraps:
int, default=1000
- param ci:
Confidence interval level (e.g., 0.95 for 95% CI).
- type ci:
float, default=0.95
- param random_state:
Random seed for reproducibility.
- type random_state:
int, optional
- returns:
bootstrap_df – DataFrame with Model, Metric, Estimate (observed), CILower, and CIUpper.
- rtype:
pd.DataFrame
See also
coco_pipe.decoding.stats.assess_bootstrap_ciUnderlying engine.
- compare_models(models=None, metric='accuracy', unit=None, n_permutations=1000, correction='fdr_bh', random_state=None)#
Perform exhaustive pairwise comparisons between multiple models.
Automatically applies p-value correction (e.g., FDR) for the multiple comparisons performed across all pairs of models.
Scientific Rationale#
Benchmarking multiple models requires controlling for the ‘multiple comparisons problem’—the increased risk of Type I errors (false positives) when testing many hypotheses. This method automates the pairwise testing and subsequent error-rate control.
- param models:
List of model names to compare. Default is all models in the result.
- type models:
list of str, optional
- param metric:
Metric to use for comparison.
- type metric:
str, default=’accuracy’
- param unit:
Level of independence for permutation testing (e.g., ‘subject’).
- type unit:
str, optional
- param n_permutations:
Number of permutations for each paired test.
- type n_permutations:
int, default=1000
- param correction:
Multiple comparison correction method (e.g., ‘bonferroni’, ‘fdr_bh’).
- type correction:
str, default=’fdr_bh’
- param random_state:
Random seed for permutations.
- type random_state:
int, optional
- returns:
comparison_df – DataFrame containing ModelA, ModelB, Difference, and corrected PValue (PValueCorrected).
- rtype:
pd.DataFrame
See also
ExperimentResult.compare_models_pairedUnderlying paired test.
- compare_models_paired(model_a, model_b, metric='accuracy', unit=None, n_permutations=1000, random_state=None)#
Paired model comparison using outer-fold predictions on shared samples.
Performs a within-unit permutation test (e.g., swapping model labels per subject) to determine if the performance difference is significant.
Scientific Rationale#
Paired tests are generally more powerful than independent-sample tests because they control for unit-specific baseline variance (e.g., a subject who is overall ‘harder’ to decode). By aligning predictions at the sample level across models, we ensure a valid paired comparison.
- param model_a:
The names of the two models to compare.
- type model_a:
str
- param model_b:
The names of the two models to compare.
- type model_b:
str
- param metric:
Metric to use for comparison.
- type metric:
str, default=’accuracy’
- param unit:
Level of independence (e.g., ‘subject’).
- type unit:
str, optional
- param n_permutations:
Number of permutations for the test.
- type n_permutations:
int, default=1000
- param random_state:
Random seed for reproducible permutations.
- type random_state:
int, optional
- returns:
paired_df – DataFrame with ModelA, ModelB, ScoreA, ScoreB, Difference, and PValue.
- rtype:
pd.DataFrame
See also
coco_pipe.decoding.stats.assess_paired_comparisonUnderlying engine.
- get_feature_importances(model=None, fold_level=False)#
Get feature importances in long format.
Aggregates relative feature contributions (e.g., coefficients, Gini importance) across all folds.
Scientific Rationale#
Feature importances identify the data dimensions that drive the model’s predictions. Analyzing these across folds ensures that identified features are robust and not artifacts of a specific data split. Ranking features provides a prioritized list for subsequent biological interpretation.
- param model:
The model name to filter by. Default is None (all models).
- type model:
str, optional
- param fold_level:
If True: Returns importance for each fold individually.
If False: Returns the mean and standard deviation across folds.
- type fold_level:
bool, default=False
- returns:
importances_df – DataFrame with Model, FeatureName, and Importance (or Mean/Std). Includes a ‘Rank’ column based on the importance magnitude.
- rtype:
pd.DataFrame
See also
ExperimentResult.get_selected_featuresIf feature selection was used.
- get_best_params(model=None)#
Get the best hyperparameters selected per fold.
If hyperparameter tuning was enabled, returns the optimal configuration found in each cross-validation outer fold.
- Parameters:
model (str, optional) – The name of the model to filter by. Default is None (all models).
- Returns:
params_df – DataFrame with Model, Fold, Param, and Value.
- Return type:
pd.DataFrame
See also
ExperimentResult.get_search_resultsDetailed tuning diagnostics.
- get_search_results(model=None)#
Get compact hyperparameter-search diagnostics in long form.
Provides a summary of all candidate configurations evaluated during tuning, including their mean performance and ranking.
- Parameters:
model (str, optional) – The model name to filter by. Default is None (all models).
- Returns:
search_df – DataFrame with Model, Fold, Candidate, Rank, MeanTestScore, StdTestScore, and Params.
- Return type:
pd.DataFrame
See also
ExperimentResult.get_best_paramsJust the winner per fold.
- get_selected_features(model=None)#
Get fold-level selected feature masks in long format.
Returns a boolean mask indicating which features were retained by automated feature selection in each fold.
- Parameters:
model (str, optional) – The model name to filter by. Default is None (all models).
- Returns:
features_df – DataFrame with Model, Fold, FeatureName, and Selected status. Includes an ‘Order’ column if recursive or sequential selection was used.
- Return type:
pd.DataFrame
See also
ExperimentResult.get_feature_stabilityCross-fold selection consistency.
- get_feature_scores(model=None)#
Get fold-level feature-selection scores.
Accesses raw univariate or multivariate scores (e.g., F-values, p-values, or internal selector scores) used for feature ranking.
- Parameters:
model (str, optional) – The model name to filter by. Default is None (all models).
- Returns:
scores_df – DataFrame with Model, Fold, FeatureName, Score, and PValue (if available).
- Return type:
pd.DataFrame
See also
ExperimentResult.get_selected_featuresFinal binary selection mask.
- get_feature_stability(model=None)#
Analyze feature selection stability across folds.
Calculates the frequency with which each feature was selected across the cross-validation procedure.
Scientific Rationale#
Stability analysis helps distinguish robust predictors from features that are selected due to noise in specific data splits. High stability (e.g., > 90% of folds) provides strong evidence for the relevance of a feature to the decoding task.
- param model:
The model name to filter by. Default is None (all models).
- type model:
str, optional
- returns:
stability_df – DataFrame with Model, FeatureName, SelectionFrequency (0.0 to 1.0), and NFolds.
- rtype:
pd.DataFrame
See also
ExperimentResult.get_selected_featuresFold-level selection data.
- Parameters:
model (str | None)
- Return type:
DataFrame
- get_generalization_matrix(model=None, metric='accuracy')#
Get Generalization Matrix (Train Time x Test Time) averaged across folds.
Computes the cross-temporal performance matrix for Time-Generalization analysis.
Scientific Rationale#
Temporal Generalization (TG) analysis reveals the dynamics of neural representations. By training a classifier at one time point and testing it across all others, we can identify whether a neural pattern is transient, sustained, or reoccurring.
- param model:
The model name to filter by. Default is None (all models). If None, returns a long-format DataFrame suitable for plotting.
- type model:
str, optional
- param metric:
The metric to retrieve.
- type metric:
str, default=’accuracy’
- returns:
gen_df –
If model is specified: A square matrix (2D DataFrame) with TrainTime as index and TestTime as columns.
If model is None: A tidy long-format DataFrame with Model, Metric, TrainTime, TestTime, and Value.
- rtype:
pd.DataFrame
See also
ExperimentResult.get_temporal_score_summaryLinear temporal summary.
Examples using coco_pipe.decoding.ExperimentResult#
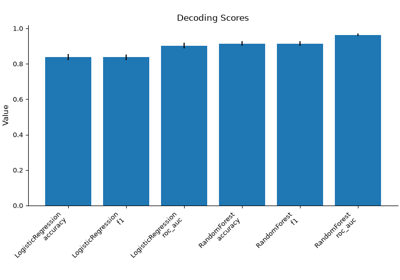
Basic Decoding: Classification and Model Verification