coco_pipe.viz.plot_decoding_scores#
- coco_pipe.viz.plot_decoding_scores(result, metric=None, model=None, kind='point', aggregate='mean', ax=None, figsize=None)#
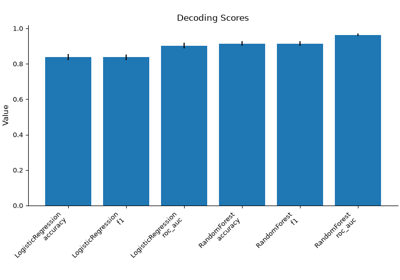
Plot aggregate scalar decoding scores by model and metric.
- Parameters:
result (Any) – Experiment result with
get_detailed_scores()or a detailed score DataFrame containing scalarValuerows.metric (str | None) – Optional metric name used to filter scores.
model (str | None) – Optional model name used to filter scores.
kind (Literal['point', 'bar', 'box']) – Plot type:
"point"for aggregate +/- SEM,"bar"for bar summaries, or"box"for fold-level distributions.aggregate (Literal['mean', 'median']) – Summary statistic used by
"point"and"bar"plots.ax (Axes | None) – Existing Matplotlib axes to draw into.
figsize (tuple[float, float] | None) – Figure size used when creating a new axes.
- Returns:
The created or reused figure and axes.
- Return type:
See also
coco_pipe.viz.interactive.decoding.plot_decoding_scoresInteractive Plotly version.
plot_model_comparisonScore differences between model pairs.
plot_fold_score_dispersionPer-fold score spread.
plot_null_interval_summaryObserved scores versus null bands.
Examples
>>> import pandas as pd
>>> from coco_pipe.viz import decoding as viz
>>> df = pd.DataFrame(
...     {
...         "Model": ["SVM"] * 5,
...         "Metric": ["accuracy"] * 5,
...         "Type": ["detailed_score"] * 5,
...         "Value": [0.71, 0.73, 0.69, 0.74, 0.70],
...     }
... )
>>> fig, ax = viz.plot_decoding_scores(df)
Examples using coco_pipe.viz.plot_decoding_scores#
Basic Decoding: Classification and Model Verification