coco_pipe.viz.plot_confusion_matrix#
- coco_pipe.viz.plot_confusion_matrix(result_or_matrix, model=None, fold=None, title=None, ax=None, figsize=None)#
Plot an aggregated confusion matrix from decoding diagnostics.
- Parameters:
result_or_matrix (Any) – Experiment result with
get_confusion_matrices()or a tidy confusion matrix DataFrame containingTrueLabel,PredictedLabel, andValue.model (str | None) – Optional model name used to filter rows before aggregation.
fold (int | None) – Optional fold index used to filter rows before aggregation.
title (str | None) – Optional axes title. Defaults to
"Confusion Matrix".ax (Axes | None) – Existing Matplotlib axes to draw into.
figsize (tuple[float, float] | None) – Figure size used when
axis not provided.
- Returns:
The created or reused figure and axes.
- Return type:
See also
coco_pipe.viz.interactive.decoding.plot_confusion_matrixInteractive Plotly version.
plot_roc_curveReceiver-operating-characteristic curve.
plot_probability_diagnosticsProbability-calibration quality metrics.
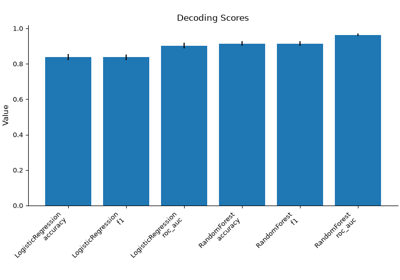
plot_decoding_scoresAggregate scalar score summary.
Examples
>>> import pandas as pd
>>> from coco_pipe.viz import decoding as viz
>>> df = pd.DataFrame(
...     {
...         "TrueLabel": list("AABB"),
...         "PredictedLabel": list("ABAB"),
...         "Value": [5, 1, 2, 4],
...     }
... )
>>> fig, ax = viz.plot_confusion_matrix(df)
Examples using coco_pipe.viz.plot_confusion_matrix#
Basic Decoding: Classification and Model Verification