coco_pipe.viz.plot_embedding#
- coco_pipe.viz.plot_embedding(X_emb, labels=None, metadata=None, dims=(0, 1), title='Embedding', figsize=(10, 8), cmap=None, palette='deep', s=40, alpha=0.8, label_kind='categorical', metrics=None, metric_name=None, ax=None, random_state=None)#
Plot an explicit 2D or 3D embedding.
- Parameters:
X_emb (ndarray) – Embedding array with shape
(n_samples, n_dimensions).labels (ndarray | None) – Optional label array aligned with samples used for color encoding.
metadata (dict[str, Any] | None) – Optional column-oriented metadata aligned with samples.
dims (tuple[int, int] | tuple[int, int, int]) – Column indices to use as plot axes. Two indices produce a 2D plot; three produce a 3D plot.
title (str) – Axes title.
figsize (tuple[float, float] | None) – Figure size used when creating new axes.
cmap (str | None) – Colormap used when
label_kind="continuous".palette (str) – Seaborn palette name used when
label_kind="categorical".s (int) – Scatter marker size.
alpha (float) – Scatter point opacity.
label_kind (Literal['categorical', 'continuous']) –
"categorical"to color by class,"continuous"to apply a colormap to numeric labels.metrics (dict[str, Any] | None) – Optional metrics mapping used to annotate the plot when
metric_nameis provided.metric_name (str | None) – Name of the metric from
metricsto display as an annotation.ax (Axes | None) – Existing Matplotlib axes to draw into.
random_state (int | None) – Accepted for API compatibility; not used internally.
- Returns:
The created or reused figure and axes.
- Return type:
See also
coco_pipe.viz.interactive.dim_reduction.plot_embeddingInteractive Plotly version.
plot_metricsQuality metric overview for the embedding run.
plot_shepard_diagramDistance-preservation diagnostic.
plot_eigenvaluesExplained variance for linear reducers.
Examples
>>> import numpy as np
>>> from coco_pipe.viz import dim_reduction as viz
>>> rng = np.random.default_rng(42)
>>> X_emb = rng.normal(size=(50, 2))
>>> labels = np.arange(50) % 5
>>> fig, ax = viz.plot_embedding(X_emb, labels=labels)
Examples using coco_pipe.viz.plot_embedding#
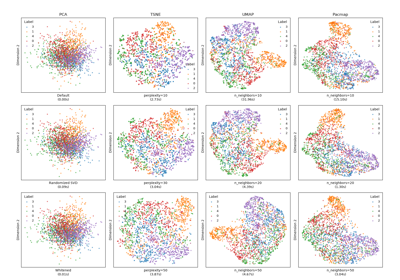
Comprehensive Comparison of Dimensionality Reduction Methods
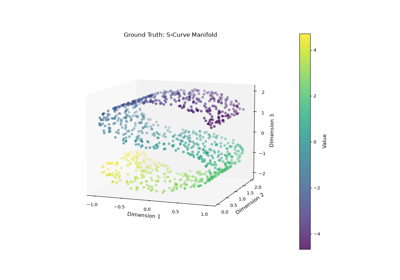
Benchmarking Dimensionality Reduction: The Epistemology of Embeddings