Note
Go to the end to download the full example code.
Basic Decoding: Classification and Model Verification#
This example demonstrates the core functionality of the coco_pipe.decoding module.
We generate a synthetic classification dataset and evaluate two classical machine
learning models (Logistic Regression and Random Forest) using a rigorous
cross-validation pipeline.
The decoding engine automatically handles data splitting, model fitting, metric calculation, and produces an ExperimentResult object that natively integrates with our visualization tools.
Imports and Setup#
import matplotlib.pyplot as plt
from sklearn.datasets import make_classification

from coco_pipe.decoding import Experiment, ExperimentConfig
from coco_pipe.decoding.configs import (
    CVConfig,
    LogisticRegressionConfig,
    RandomForestClassifierConfig,
)
from coco_pipe.viz.decoding import plot_confusion_matrix, plot_decoding_scores
1. Generate Synthetic Data#
We create a synthetic 2-class dataset with 500 samples and 20 features, where only 5 features are truly informative.
X, y = make_classification(
    n_samples=500,
    n_features=20,
    n_informative=5,
    random_state=42,
)
2. Configure the Experiment#
The ExperimentConfig defines the entire analytical pipeline declaratively.
We specify the task, the models to evaluate, the evaluation metrics, and the
cross-validation strategy.
config = ExperimentConfig(
    task="classification",
    models={
        "LogisticRegression": LogisticRegressionConfig(),
        "RandomForest": RandomForestClassifierConfig(n_estimators=50, random_state=42),
    },
    metrics=["accuracy", "roc_auc", "f1"],
    cv=CVConfig(strategy="stratified", n_splits=5, random_state=42),
)

# Initialize the experiment engine
exp = Experiment(config)
3. Execute the Decoding Pipeline#
The run method takes the data and executes the cross-validation
loop for all declared models.
Executing decoding pipeline...
[Parallel(n_jobs=-1)]: Using backend LokyBackend with 4 concurrent workers.
[Parallel(n_jobs=-1)]: Done   5 out of   5 | elapsed:    2.8s finished
[Parallel(n_jobs=-1)]: Using backend LokyBackend with 4 concurrent workers.
[Parallel(n_jobs=-1)]: Done   5 out of   5 | elapsed:    0.3s finished
Decoding complete!
4. Visualize Results#
We can pass the ExperimentResult directly into coco_pipe.viz.decoding
functions to instantly generate publication-ready plots.
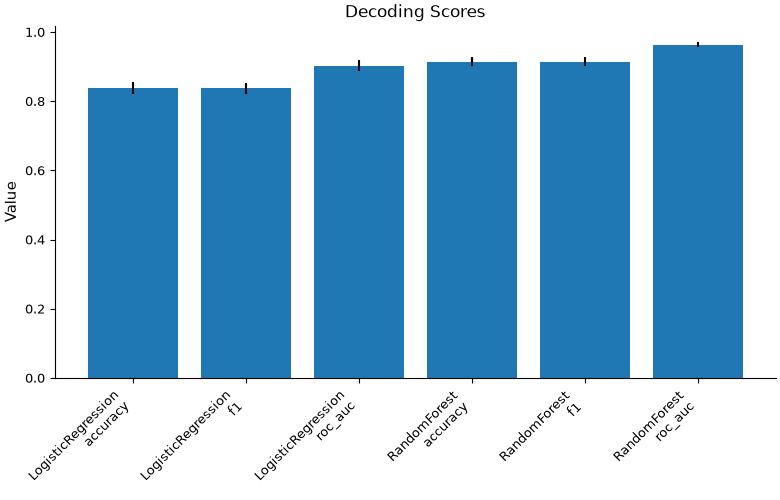
# Plot aggregate scalar scores (Accuracy, ROC AUC, F1)
plot_decoding_scores(result, kind="bar")
plt.show()
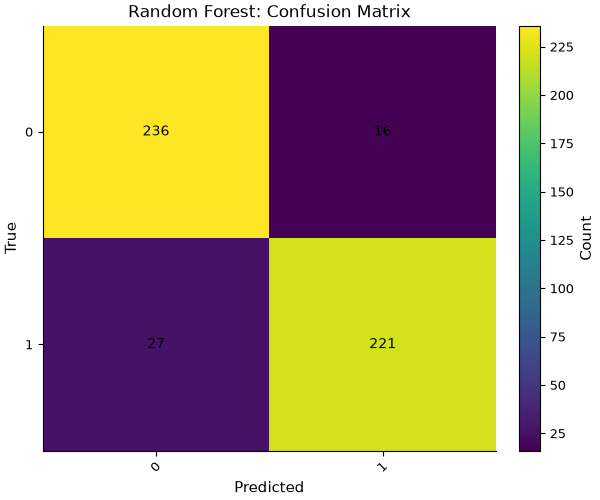
# Plot the confusion matrix for the Random Forest model
plot_confusion_matrix(
result, model="RandomForest", title="Random Forest: Confusion Matrix"
)
plt.show()
Interpretation#
Decoding Scores: The bar chart shows the mean performance metrics across all 5 cross-validation folds, including standard error bands. Random Forest often outperforms Logistic Regression on non-linear informative features.
Confusion Matrix: The matrix visualizes the out-of-fold predictions, normalized by true class counts, highlighting the model’s sensitivity and specificity.
Total running time of the script: (0 minutes 3.523 seconds)